point cloud
-

How LiDAR Point Density Is Measured
A point cloud can pass or fail a density requirement depending on how the density is measured. This article compares the common methods, explains why ASPRS now recommends Voronoi polygons, and shows what that means for planning, testing, and delivering data.
-

A Closer Look at Europe’s National LiDAR Programs
Denmark has flown its whole territory with LiDAR three times since 2007, each pass denser than the last. An interactive chart of fourteen national programs across Europe shows the same pattern: long-running, and getting denser with every cycle.
-

Ellipsoidal and Orthometric Heights in LiDAR Data
A LiDAR height is always a height above something. This article explains the ellipsoid, the geoid, and national height systems, how a point gets its elevation, how height errors show up in a delivery, and what to check before you trust the numbers.
-
LiDAR Calibration and Strip Adjustment
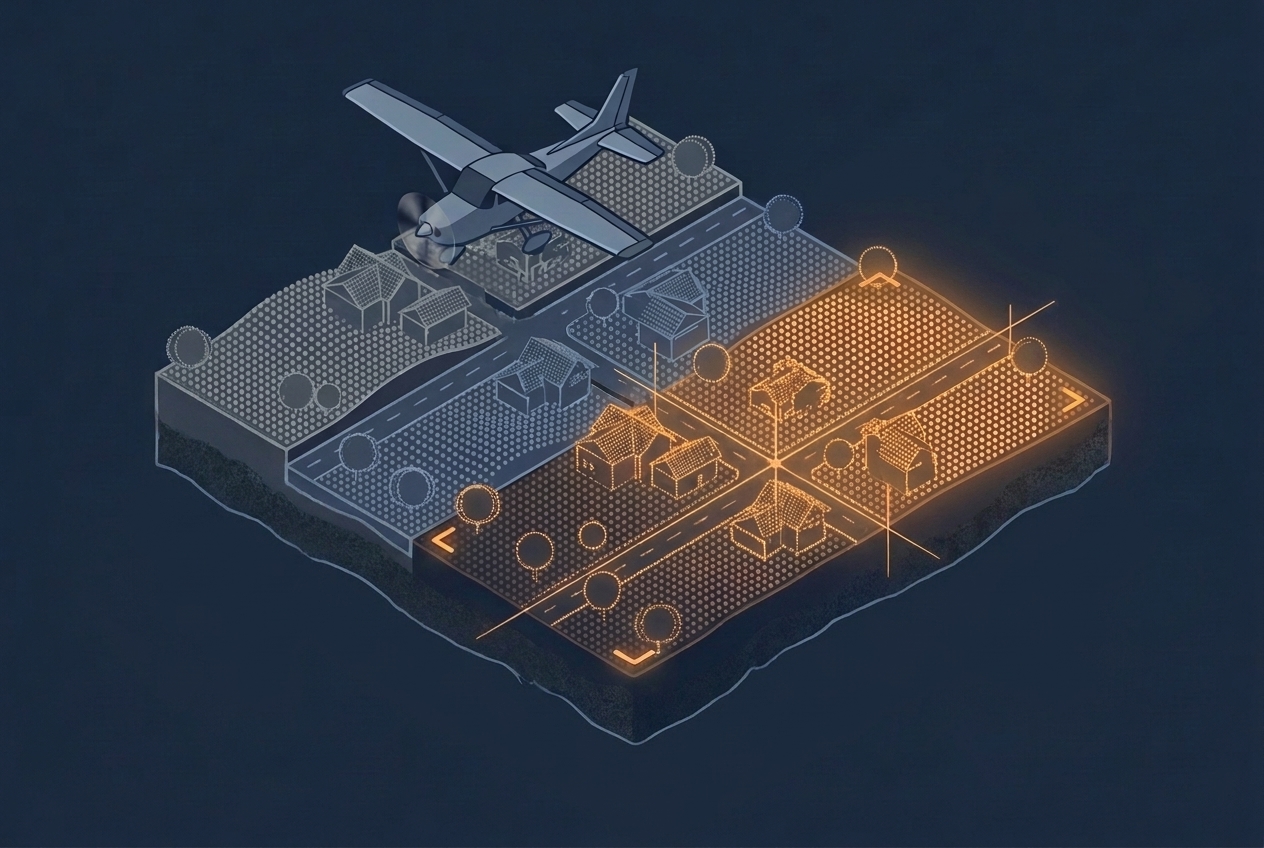
Overlapping LiDAR strips rarely line up on their own. This article explains where the offsets come from, how project calibration and strip adjustment remove them, and what to ask about both when you evaluate a dataset.
-

Watching Point Clouds Grow
Every year, aerial survey contractors fly LiDAR sensors over three and a half to four million hectares, part of a six-year cycle that eventually covers every corner of the country. That is a lot of area to scan. When I mention this to friends and colleagues, they often wonder what could possibly make it worth…
-
Understanding Scan Patterns
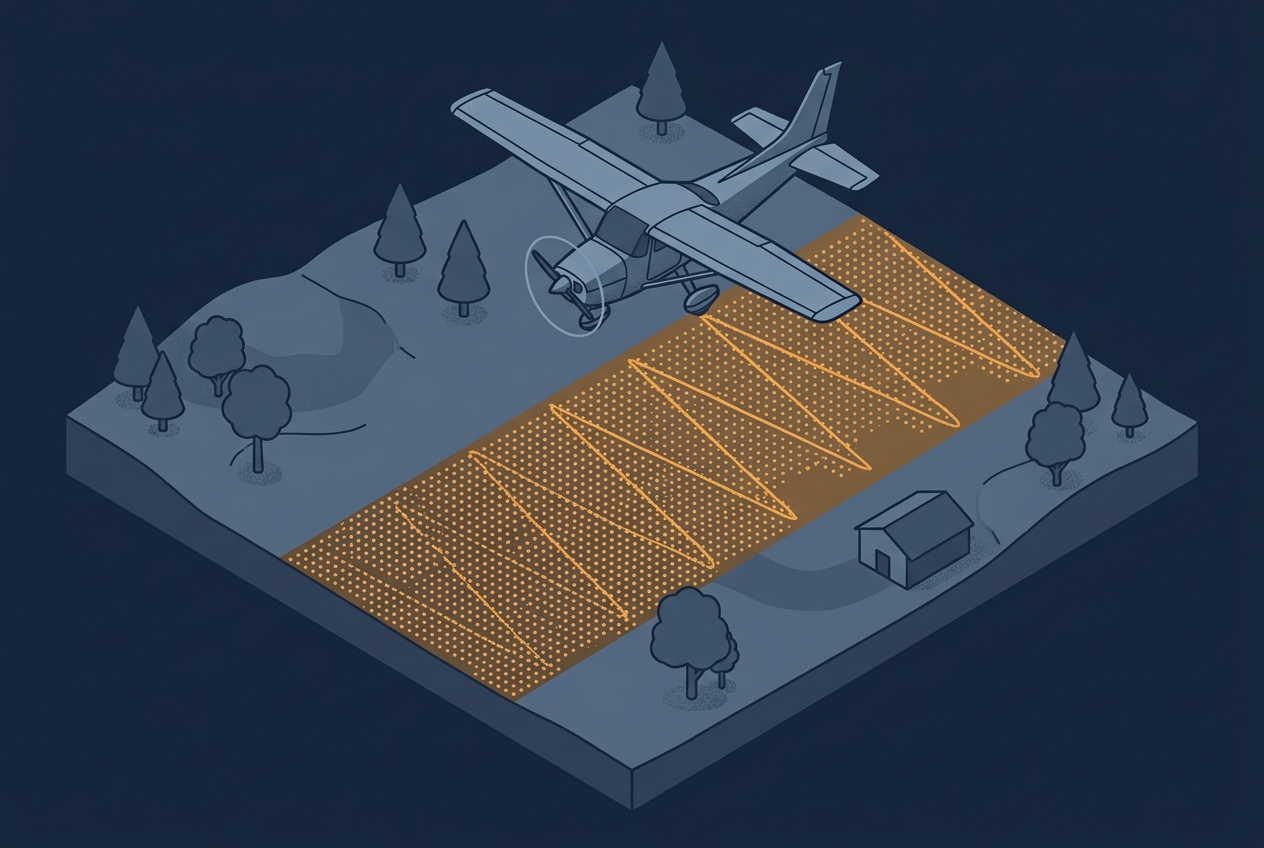
A project specification usually calls out a single number: 8 points per square meter, maybe 20 or even more. That number becomes the thing everyone plans around, quotes against, and checks in QA. Sometimes the spec is written as an average across the project area, sometimes as a minimum that has to be achieved in…