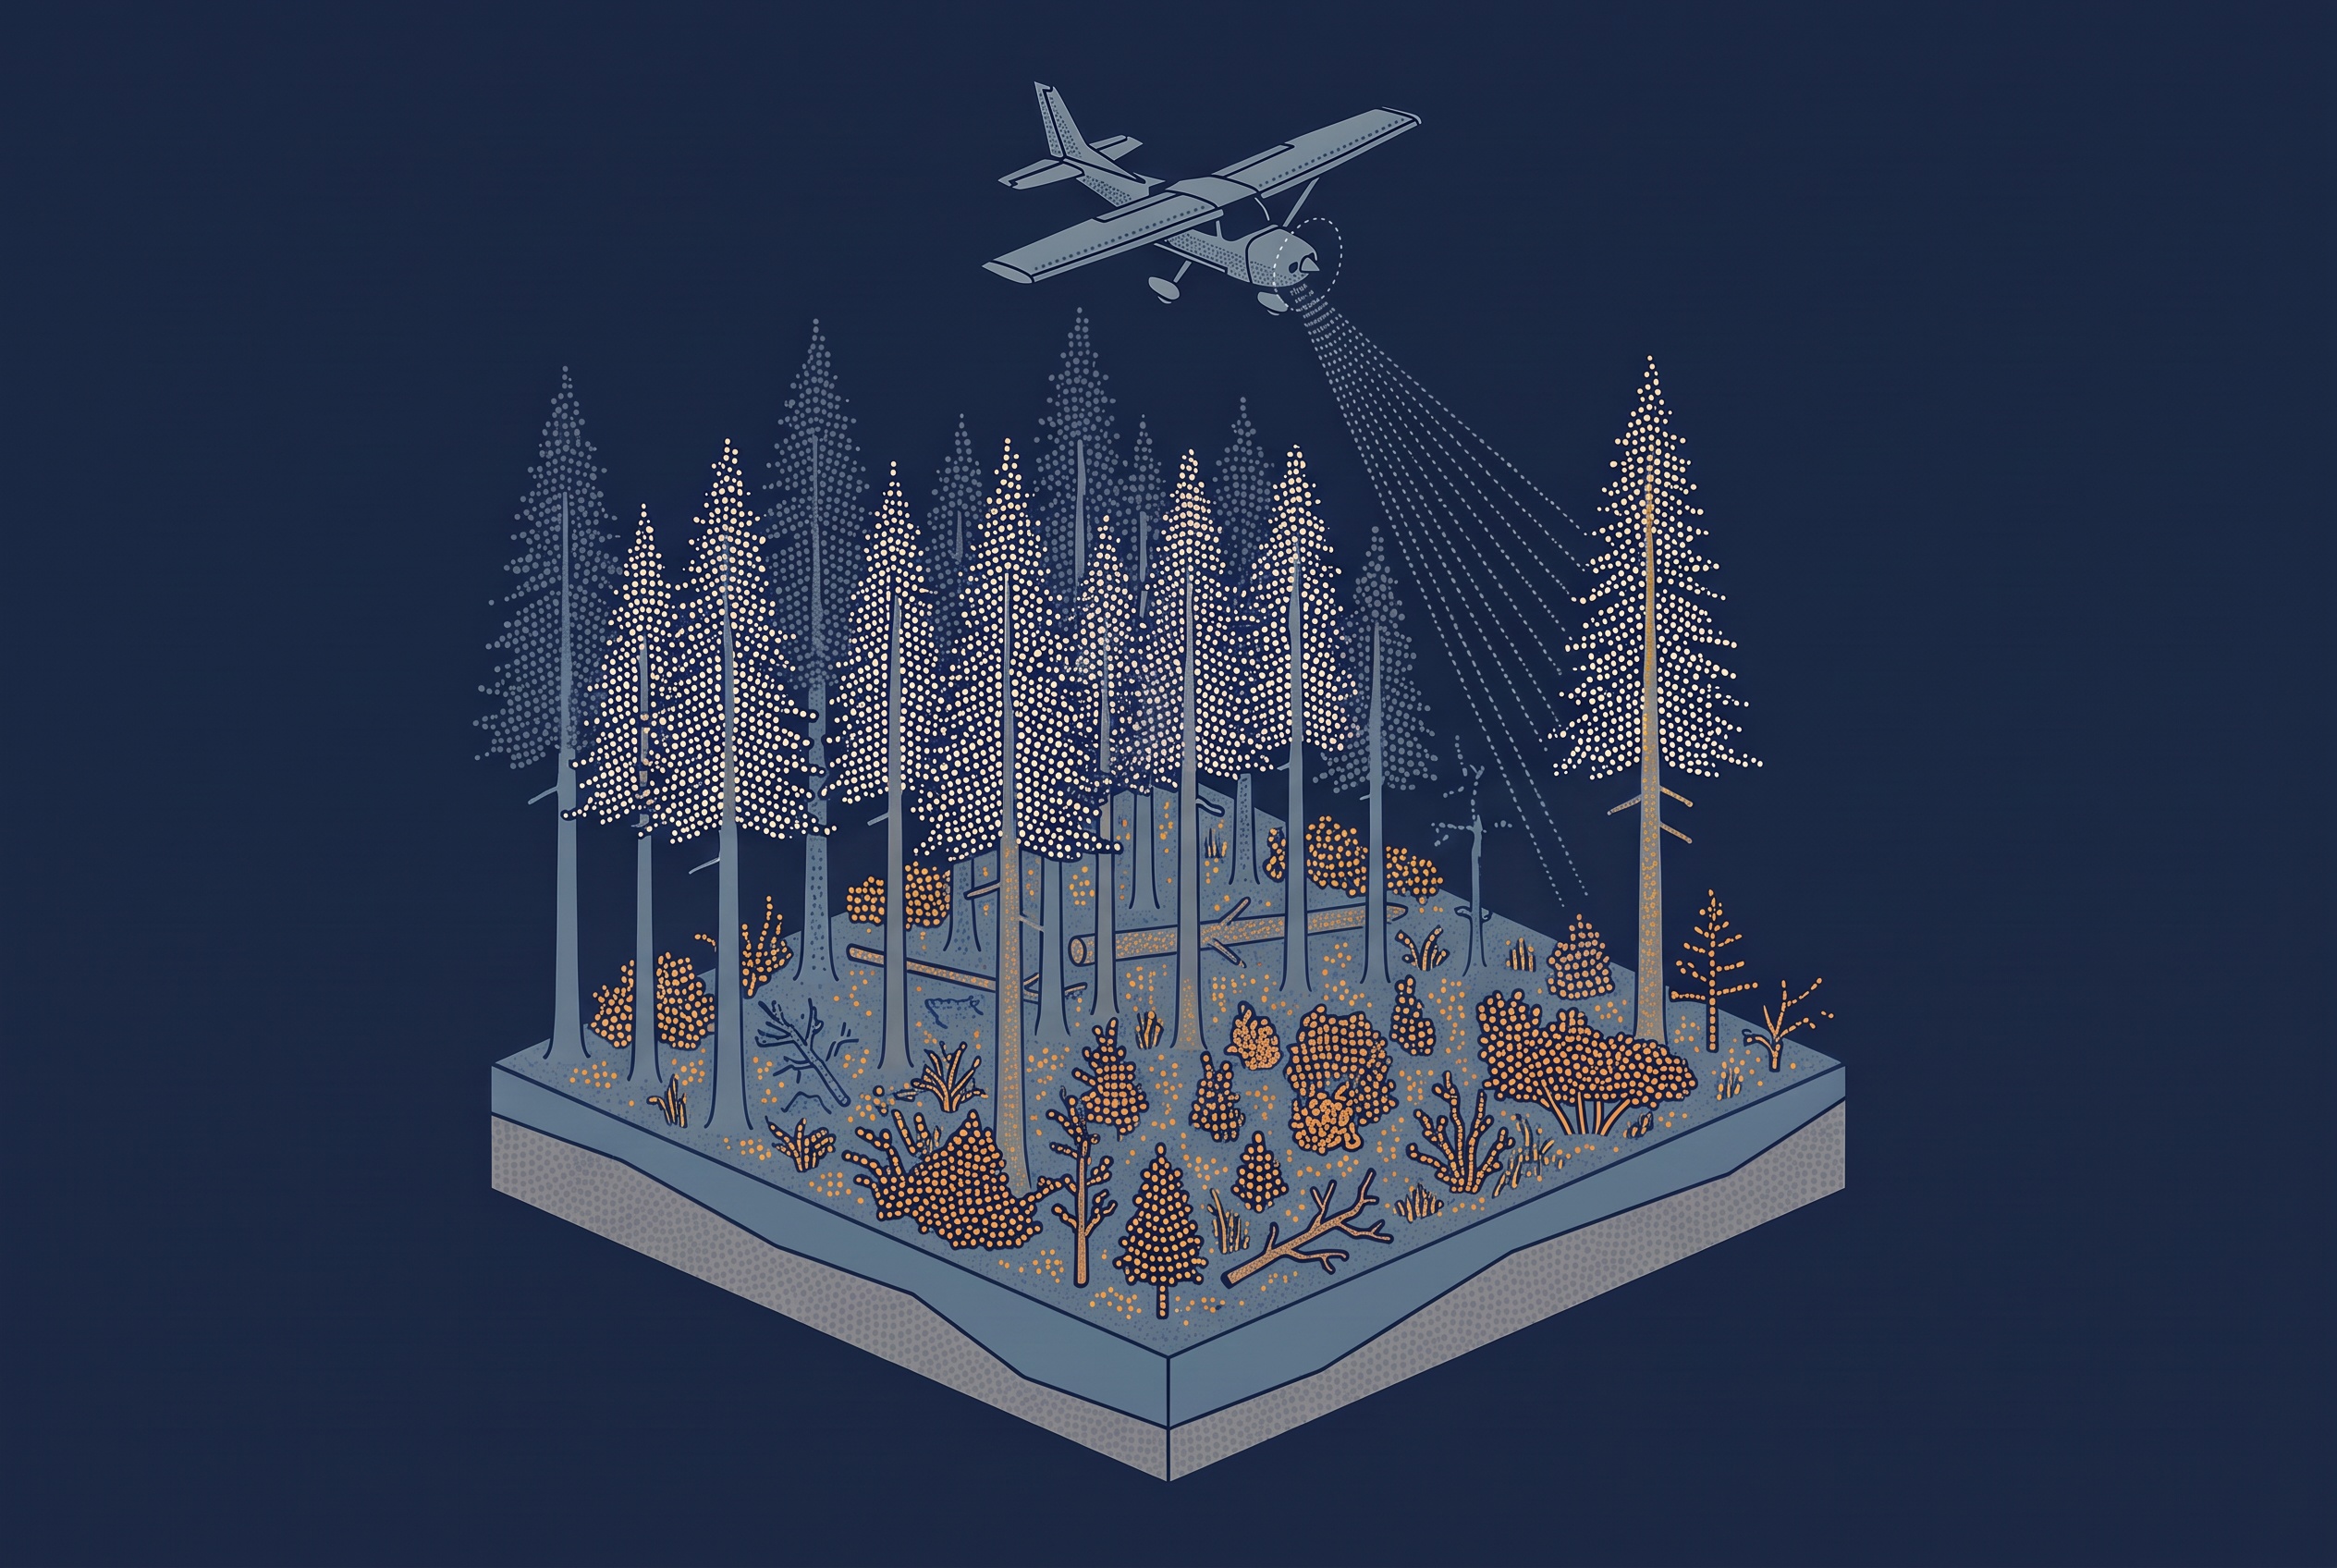
When people talk about reducing wildfire risk in a forest, the first idea is usually simple: there is too much wood that acts as fuel, so remove some of it. But which part? A forest holds most of its biomass in the trunks and crowns of large trees, and removing those is expensive and often not the goal. A study of 42 California wildfires suggests that the answer lies much lower down.
Using more than 830,000 measurements from NASA’s spaceborne GEDI LiDAR, researchers compared forest structure before each fire with how severely it burned. Total biomass and canopy height both predicted severity under normal conditions, but they lost their predictive power on steep slopes, in strong wind, and in very dry air. One measure stayed significant across all of these conditions: the amount of vegetation in the lowest ten meters of the forest, the so-called ladder fuels.
My previous article on biomass estimation touched briefly on wildfire fuel, and on how canopy bulk density and crown base height matter more for fire than total mass. This article goes one level deeper. It explains what ladder fuels are, why they are so hard to see from above, and how a LiDAR point cloud turns into a map of them.
What a Ladder Fuel Is
Fire scientists usually split forest fuel into three layers:
- Surface fuels are the grass, needles, and fallen wood on the ground.
- Crown fuels are the leaves, needles, and small branches in the tree tops.
- Ladder fuels sit in between: shrubs, young trees, and the low, dead branches of larger trees.
A fire that burns along the ground can usually be controlled. A fire that reaches the crowns spreads faster, burns hotter, and kills most of the trees it passes. Ladder fuels are what allow the flames to climb from the first kind of fire into the second. A forest with a clean gap between the ground and the crowns can carry a lot of biomass and still burn mildly. A forest where vegetation runs continuously from the ground into the canopy can burn severely even with less total fuel.
That is why the key question is not how much fuel there is, but how it is arranged vertically. And that is a question about structure, which is exactly what LiDAR measures.
Why Ladder Fuels Are Hard to See
Aerial and satellite images show the top of the canopy. Under a closed forest, the shrubs and small trees beneath it are simply not visible. Field crews can measure them, but only on small plots, and a fire management plan needs a map of the whole landscape.
LiDAR gets further because part of each pulse passes through gaps in the canopy and produces returns from the lower layers. The article on how vegetation shapes LiDAR ground returns explains how that works, and which survey choices, such as season, scan angle, and pulse rate, decide how many pulses make it through.
For ladder fuels, two points matter most. First, the lower layers are always seen through the upper ones. A dense canopy lets fewer pulses through, so fewer returns from the understory can mean less vegetation down there, or simply that the canopy blocked the view. Second, vegetation very close to the ground is hard to separate from the ground itself, because the echoes from both can merge into a single return. The lowest part of a fuel profile, below about a meter, is therefore the least reliable part of it.
Turning Returns Into a Fuel Layer
The usual approach is to cut the point cloud into horizontal slices by height above ground, for example 0 to 1 meter, 1 to 5 meters, and 5 to 10 meters. For each slice, the processing counts how many returns fall in it compared with how many pulses made it down to that height. That second number is not measured, because a pulse that produced no return leaves no trace. It is derived from the returns: the pulses reaching a slice equal those that reached the slice above, minus the returns recorded there. Dividing by the pulses that reached the layer, rather than by all pulses, is what corrects for the canopy blocking the view. The result is a vertical profile for each grid cell, a description of how much vegetation sits at each height. The counting happens per cell, so horizontal resolution matters as much as slice height. Each cell needs enough pulses reaching the lowest slices to give a stable ratio, which pushes airborne products toward cells of tens of meters, and only dense drone surveys toward a few meters.
From that profile, several fire-related values can be derived. The density in the low slices describes the ladder fuels directly. The height where the canopy starts gives the crown base height. A gap between the low and high layers shows whether a fire on the ground could reach the crowns.
The California study did something similar with spaceborne data. GEDI records a full waveform for each footprint, a continuous profile of returned energy from the tree tops to the ground. The researchers used a value called plant area index, summed for the layers between 0 and 10 meters in 5-meter steps. Because of the length of GEDI’s laser pulse, this only works in forests taller than 10 meters, where the canopy can be separated from the ground signal.
The same idea works at a much smaller scale. After the 2017 Yeste fire in southeast Spain, a team surveyed the burned area with a drone-mounted LiDAR. They used changes in the understory and midstory vegetation to tell apart areas where the fire had stayed on the ground from areas where it had climbed into the crowns.
Further reading
- GEDI Lidar Study: Ladder Fuels Key to Wildfire Severity | Lidar News
A short summary of the California study and what it suggests for fuel treatments. - Ladder fuels rather than canopy volumes consistently predict wildfire severity even in extreme topographic-weather conditions | Communications Earth and Environment
The full open-access paper, including the fuel metrics, the severity data, and the limits of the method.
From Samples to a Map
GEDI and airborne LiDAR play different roles here. GEDI does not produce a continuous image. It measures separate footprints, each about 25 meters across, along its orbit tracks. That works well for a study across dozens of fires, because the measurements are consistent across regions and years. It does not tell a land manager which hillside to thin. For that, you need a complete map, and that is where airborne and drone LiDAR come in.
Many wildfire products work at a different level. The 2026 Tasmania Wildfire Index looked at 450,356 building and rated their footprints for wildfire exposure. It places 8.6 percent of them in the four highest exposure classes. The report lists its inputs as vegetation and fuel data, topography, and climate and dryness. Its makers stress that it is a screening tool, not a fire forecast. Products like this show where risk is high. A vertical fuel layer from LiDAR can answer the next question: what in the forest causes that risk, and which treatment would change it.
Before you rely on a LiDAR-based fuel map, ask these questions:
- Was the low vegetation layer corrected for the canopy blocking the view, or are the returns simply counted?
- Was the data collected with leaves on or off, and how old is it? Understory grows back quickly after a fire or a thinning.
- How was the lowest layer handled, where echoes from low vegetation and the ground can merge into one return?
- Was the map checked against field plots in the same kind of forest?
The California study came to a practical conclusion. Treatments that target the whole canopy may do little under extreme fire weather, while treatments that break the vertical link between ground and crowns, such as thinning the understory or cultural burning, may be more effective. In the researchers’ words, sparse understories were uniformly associated with lower severity. The authors are careful not to apply this beyond the forests they studied. But the direction is clear: in fire management, the most useful layer of the point cloud may be the one closest to the ground, and the one hardest to see.
Further reading
Predicting Fire Risk with UAV Lidar | GIM International
How a drone LiDAR survey of a burned Spanish forest separated surface fire from crown fire using understory structure.