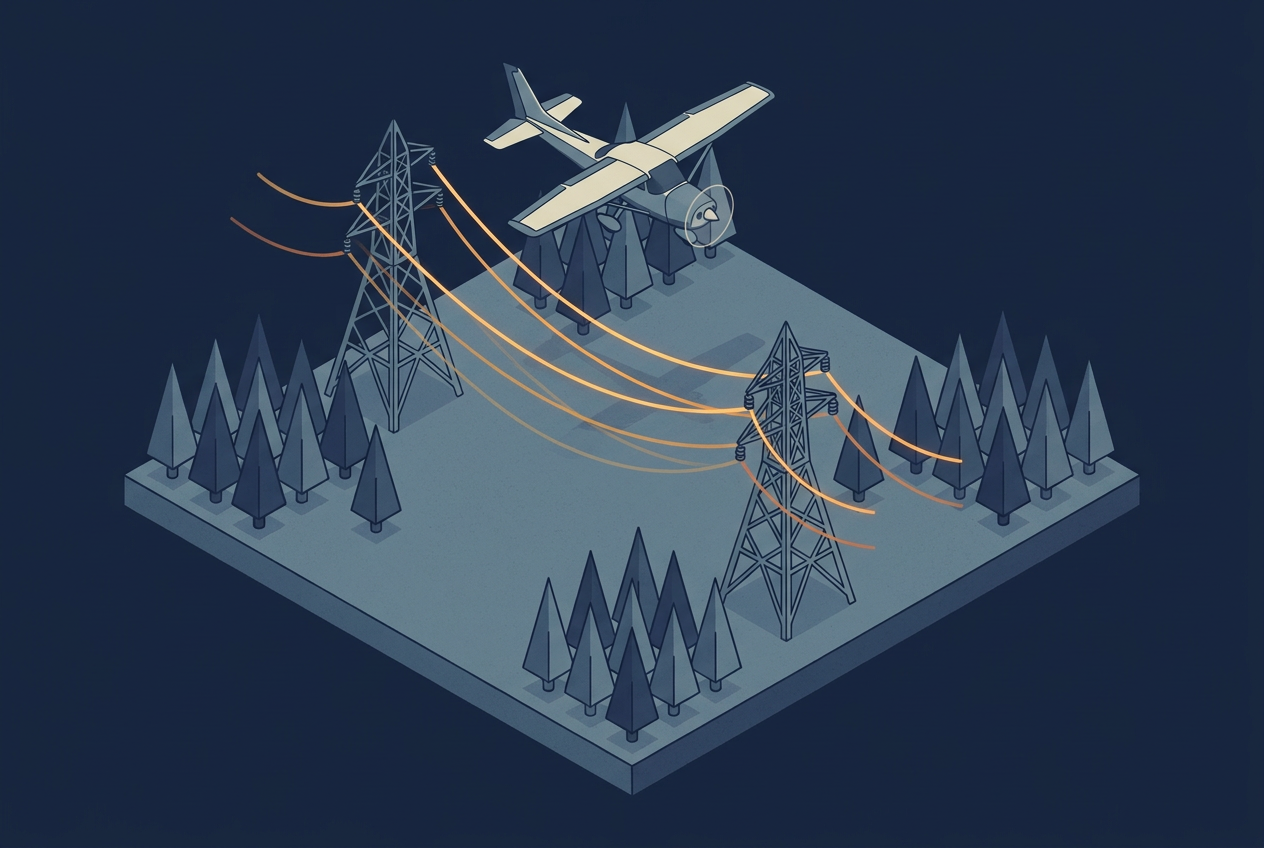
A utility in Eastern Canada is responsible for more than 103,000 kilometers of distribution lines, and it has set a goal of cutting outages in half by 2028. Trees that grow into the wires or fall onto them cause most of those outages, so the utility turned to airborne LiDAR. During the winter of 2025 and 2026, a survey company flew sections of the network in leaf-off conditions. Automated tools then classified the point cloud into poles, medium-voltage lines, and vegetation, including hazardous trees within a 30 meter buffer on each side of the network.
That result tells you which trees stand close to the wires. It does not tell you how close they will stand on the hottest afternoon of the summer, or on the windiest night of the year. Every wire in that point cloud was captured in one position, on one day, at one temperature, carrying one electrical load. Flying in winter helps the pulses reach through bare branches, and it also happens to catch the conductors cold, which is when they hang shortest and highest.
This article follows a wire from the point cloud to a clearance decision. After reading it, you will know why a clearance distance measured in a single scan is only a starting point, what engineers add to turn it into a worst-case number, and which questions to ask when someone hands you a clearance report.
From Wire Points to a Clearance Number
Before there is a clearance to measure, a laser pulse has to hit the wire. Each pulse leaves the sensor as a beam that widens with distance, and a return only comes back when that beam, with the width set by its divergence, intersects the wire. Conductors are thin, so most pulses pass beside them. The scan pattern decides how often the beam passes over the line of the wire, which is why a higher point density means more beams and a better chance of hitting it. The Eastern Canada project configured its acquisition parameters specifically so that thin conductors are detected regardless of their orientation. The scan pattern article explains why the pattern on the ground is never uniform, and a thin wire is exactly the kind of target that exposes it.
Once the wire points are classified, some gaps always remain, because some pulses pass on either side of the wire. Software closes those gaps by fitting a smooth curve through the classified points. A conductor that hangs between two supports under its own weight takes the shape of a catenary, so the fitted curve gives a continuous three-dimensional line from one structure to the next, even where the points are sparse.
Clearance is then a distance from that line to the terrain, a building, another wire, or a vegetation point. The simplest method draws fixed buffers around the line and flags anything inside them, as described in the biomass article Watching Point Clouds Grow. Fixed buffers are a reasonable first screen. They also treat the fitted line as the permanent position of the wire, and that assumption is the one the next sections take apart.
Why One Scan Shows Only One Position of the Wire
Sag is the vertical droop of a conductor between two supports. Line designers build it in on purpose, because a wire pulled tight would carry far too much mechanical tension. The amount of conductor sag is not fixed, though. The most important factor is conductor temperature. Warm air, sunshine, and the current flowing through the wire all heat the metal, the metal expands, and the wire hangs lower. Wind and ice change it as well, and an aging conductor can slowly stretch and sag more over the years, as a study in Remote Sensing summarizes.
A test by the survey company Network Mapping shows how large the effect is. They flew the same section of line at 8:30 in the morning and again at 4:30 in the afternoon, expecting higher air temperature, higher electrical load, and more sunshine in the afternoon. They calculated the conductor temperature with the method of the IEEE 738 standard, which relates the temperature of a bare overhead conductor to its current and the weather. From that temperature they predicted where the wire should hang under those conditions, and compared the prediction with the LiDAR points from both flights. The two agreed well. The test showed that the wire sits in a different place from one flight to the next, and that this movement can be predicted. The prediction only worked because the conditions were known for the time of each flight: the air temperature, the electrical load, the sunshine, and the wind. A model needs all of these values for the moment the data was collected, and without them it has nothing to start from.
The consequence is that the state of the line during a flight does not necessarily match the state that matters most for safety. A cold winter scan shows close to the smallest sag the wire will have all year. Winter is not always the best case, however, because a cold line can also be weighed down by ice, which pulls the wire down.
Further reading
- Temperature calculations and LiDAR positions | Network Mapping
A presentation to a PLS-CADD user group that compares a line flown in the morning and again in the afternoon with modeled wire positions. - Advanced Power Line Diagnostics Using Point Cloud Data: Possible Applications and Limits | Remote Sensing
A sensitivity study of how errors in temperature, tension, and other inputs change the recalculated sag of a conductor.
Blowout: When Wind Moves the Wire Sideways
Sag moves the wire up and down. Blowout moves it sideways, as wind pushes the conductor away from its resting position beneath the supports. The wire can swing out to either side, so the danger zone around a conductor is not a line. It is an envelope that runs from the hanging position out to the blowout position on the left, and out to the one on the right.
This changes which trees matter. A tree beside the corridor can look comfortably clear in plan view and still be inside the swing of the wire. The movement is also not the same everywhere along a span. Near a structure the wire is held in place, and in the middle of the span it is free to move the most, so vegetation risk is not uniform along the line. Engineering software can check clearances at the left and right blowout positions and along the arc between them, as Power Line Systems describes for PLS-CADD.
Utilities write this envelope into their own rules. One published vegetation program from PPL Electric Utilities, for example, defines its conductor-to-vegetation clearances by the wire positions between maximum vertical sag and a 30 degree blowout. The numbers differ from utility to utility, but the structure of the rule is the same everywhere: clearance is judged against the whole range of positions the wire can reach, not against the one position a scan happened to record.
How Standards Turn This Into Required Practice
In North America, transmission owners work under the vegetation management standard FAC-003 of the North American Electric Reliability Corporation (NERC). Its core is the minimum vegetation clearance distance (MVCD), the calculated distance needed to prevent flashover between a conductor and vegetation, which varies with altitude and operating voltage. Owners must keep vegetation from encroaching into the MVCD, and they must maintain documented strategies that account for the movement of the conductors, meaning sag and sway, under all rated electrical operating conditions.
For LiDAR work, the practical meaning is that an operator has to show that the MVCD is respected under all applicable load and weather cases, not only on the day of the survey. According to LIDAR Magazine, a NERC alert in 2010 led to LiDAR-based as-built models for much of the transmission network in the United States and Canada, with conductor positions modeled at maximum sag and sway. FAC-003 covers transmission lines, so a distribution project like the one in Eastern Canada follows its own utility rules. Outside North America, other national or regional standards apply, and their details differ. The physics of the wire does not change with the voltage or the country, though.
Further reading
- Compliance Through Deployment of LiDAR Technology: NERC FAC-003 | Renewable Energy World
Paul Richardson of Network Mapping explains how classified LiDAR data feeds a clearance model that includes sag and blowout. - NERC FAC-003-3: The Use of Lidar in Transmission Vegetation Management | LIDAR Magazine
An overview of what the standard requires and how LiDAR surveys can serve both vegetation management and line rating work.
Modeling the Worst Case From a Single Scan
The step from the scanned wire to the worst-case wire is done in line engineering software such as PLS-CADD. The fitted wire becomes a mechanical model with a known conductor type, span length, and tension. The model starts from the conditions on the day of the flight, then recalculates where the wire would hang at the hottest temperature, under the heaviest load, with ice, and with wind.
Newer work pushes this further. A 2026 paper from the engineering company DNV and the grid operator TenneT, published by CIGRE, couples local climate data with a finite element model of the conductor. They applied it span by span to a 150 kV line in the Netherlands, instead of relying on the conservative assumptions that traditional clearance assessments use for sag and weather. The authors report that combining LiDAR, climate data, and detailed conductor modeling improves the accuracy and reliability of the clearance assessment.
The recalculation is only as good as its inputs, however. The Remote Sensing study mentioned earlier tested how errors in the initial temperature, the tension, the conductor stiffness, the load, and the span length affect the recalculated sag. In some cases the resulting sag errors reached sizes comparable to the minimum clearance distances in technical standards. A model that looks precise can therefore hide a large uncertainty, and that uncertainty begins in the data collected on the day of the flight.
What to Record During Acquisition
If the model starts from the conditions of the flight, then those conditions need to be written down. The most useful records are the time each section of the line was flown, the air temperature, the sunshine or cloud cover, the wind speed and direction near the line, and the electrical load on the line at that time, which only the utility can provide. Conductor type and span details come from the utility as well.
Time of day deserves attention at the planning stage too. A line flown at dawn and the same line flown in the middle of an afternoon are in two different states, and a project that spans several days will contain many of them. Recording the conditions per flight is cheap while the aircraft is in the air and harder to reconstruct afterward, because a distant weather station rarely describes the conditions at the line for the moment each section was flown. These records are also what the reader of a delivered clearance report should look for, which leads to a few questions worth asking of every report.
Questions to Ask About a Clearance Report
When a vendor delivers clearance results, a few questions show quickly whether sag and blowout were handled. Does the report state the conditions of the wires at the time of the flight? Does it show clearances both as flown and at a modeled worst case, such as maximum sag and a defined blowout? Does the clearance allowance include the flashover distance, a growth allowance for how far the vegetation can grow before the next inspection, and a buffer for LiDAR accuracy, which is how PLS-CADD suggests setting it up? And are the results given span by span, since the movement of the wire differs along the line?
A report that answers all four is not automatically correct, but it shows that the people who made it know the wire moves. A report that answers none of them is probably a fixed buffer around a single snapshot, which may be fine as a screening tool and should be labeled as one.
Further reading
- Refined Clearance Assessment of Overhead Lines Combining LiDAR, Climate Data, and PLS-CADD Finite Element Analysis | CIGRE
A 2026 paper by DNV and TenneT that applies span-by-span clearance modeling to a 150 kV line in the Netherlands. - The Engineering Behind Smarter Utility Vegetation Management | Bentley Systems
A practitioner view on why vegetation management needs the full range of conductor movement and not a calm-day snapshot.
Where This Connects
In the biomass article, I described encroachment as a geometry problem, and that is still true. What this article adds is that the geometry belongs to an object that moves. A point cloud records the wire at one instant, and the decision depends on all the instants the scan did not see.
The same idea matters whenever a line is surveyed more than once. If a corridor is flown in winter one year and in summer the next, part of the difference between the two point clouds is the wire itself, and a change detection result can report seasonal sag as if it were real change. Comparing two surveys fairly requires bringing both to the same conditions first, using the same recalculation that produces a worst-case wire, and it is one more reason the temporal resolution of a program deserves as much thought as its point density.
The relationship also runs in the other direction. If temperature and load tell you how far a wire sags, then a measured sag tells you something about how hot the wire is, and therefore how much current the line can safely carry. Researchers are already working on that idea, which is known as dynamic line rating. A study titled Conductor Reconstruction for Dynamic Line Rating Using Vehicle-Mounted LiDAR shows one approach, although it works from a vehicle on the ground and not from an aircraft. It leads to a different question from vegetation clearance, namely how much capacity an existing line still has. A scan flown to find clearance problems might therefore also say something about how much current the line can carry, and whether one survey can answer both questions is worth deciding before the flight is planned.