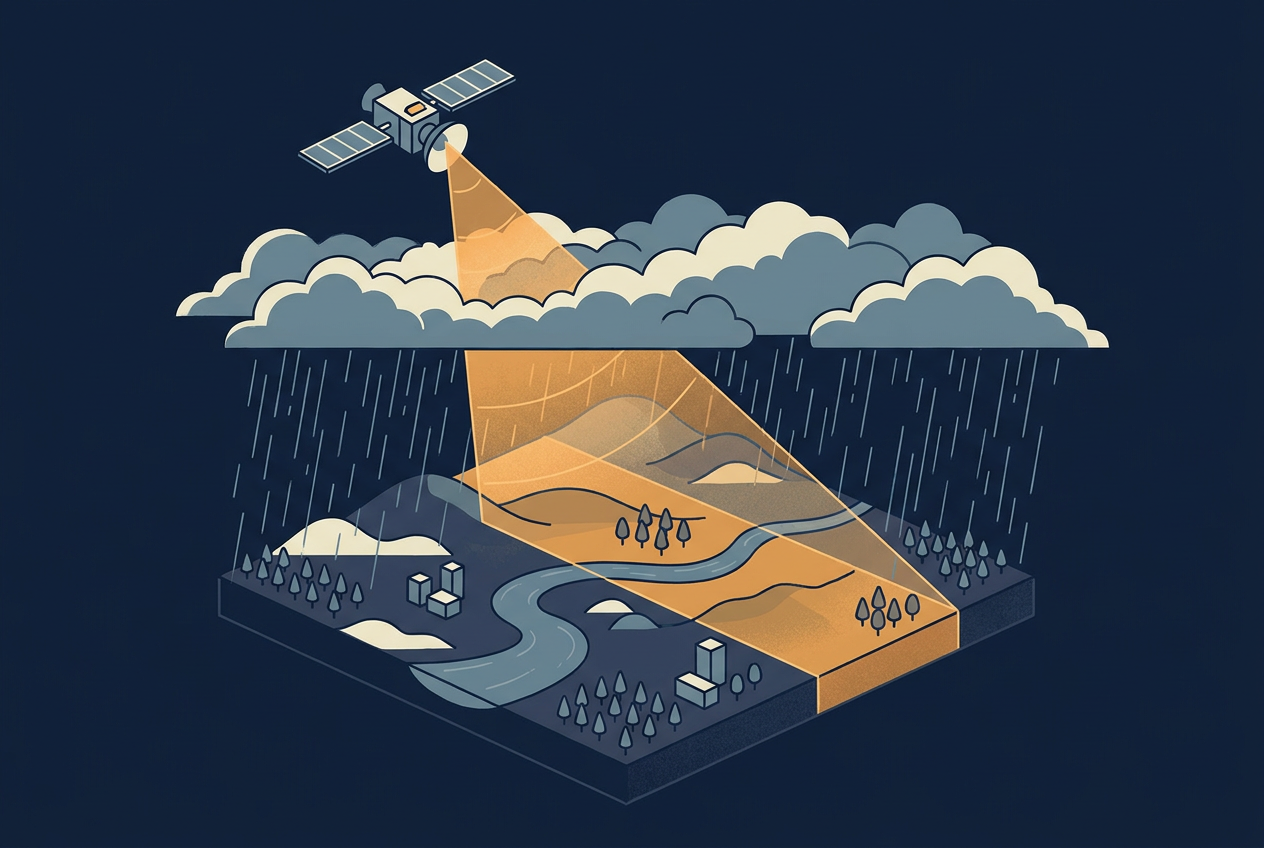
Some years ago I prepared a technical proposal for an airborne LiDAR survey in Indonesia. My weather research for the project area showed clouds and rain throughout almost the whole year. LiDAR cannot measure through thick cloud or rain, so the plan had to allow for long periods of waiting for flyable days, and every waiting day added to the estimated cost. The tender was canceled in the end, and I still wonder how much that weather risk played a part.
A radar satellite would not have had that problem, because microwaves pass through clouds and rain. That is the main reason synthetic aperture radar, or SAR, has moved from specialist laboratories into disaster response, insurance, and infrastructure monitoring. SAR data might look like an image, but it does not behave like a photograph, and it does not behave like a point cloud either. It is a powerful technology that many struggle to understand.
This article explains how a SAR satellite builds an image, why it works through clouds, which other parameters shape what it measures, and where it is used today, including the measurement of ground motion in millimeters. Along the way it also looks at how SAR relates to LiDAR, since many geospatial practitioners meet SAR with that comparison in mind.
What a Radar Satellite Measures
Radar stands for radio detection and ranging. A SAR satellite sends pulses of microwave energy toward the ground and records the echoes. The time between sending a pulse and receiving its echo gives the distance to the surface. So far this sounds very similar to LiDAR, except that where a LiDAR beam is actively diverted to different positions, a satellite covers the ground with a large footprint and through its forward movement. By doing so it creates a swath that is defined by the near and far end of the footprint in range direction. The footprint itself is defined by the look angle and the beam width of the antenna.
Looking straight down, a radar would get echoes at the same time coming from two points that are on either side of the satellite’s trajectory. To avoid this ambiguity, SAR antennas normally look to the side of the flight path, so that each echo (also called backscatter) can be placed along the slant range dimension.
The second dimension is the azimuth direction, which results as the motion of the radar platform as it moves over the target area. For each slant range vs azimuth combination, the strength and the phase of the returning signal is recorded. The intermediate result might look like a grayscale photograph, but it represents neither color nor elevation. At this state it also has no relation to ground, because slant range distances first need to be translated into ground dimension.
Reading a SAR image means learning how radar interacts with surfaces. A useful rule of thumb is that rougher surfaces return more energy, and roughness is always judged relative to the wavelength. Calm water and paved surfaces act like mirrors, send the energy away from the satellite, and appear dark. Bare soil and low crops scatter the energy in all directions, so part of it returns. Forests produce volume scattering, where the signal bounces between leaves, branches, trunks, and soil. Where a smooth surface meets an upright one, such as a street beside a building or standing water beside a tree trunk, the signal bounces twice and returns strongly. That double bounce makes cities and flooded vegetation appear very bright.
The side-looking geometry adds its own quirks. The instrument measures slant range, the direct line between the sensor and the target, so features in the near range appear compressed compared with the far range. Slopes facing the sensor appear compressed too (foreshortening), tall features can fold over their own base (layover), and some areas receive no signal at all (radar shadow). Correcting these effects requires a terrain model, and many SAR products are already delivered with that correction applied, so it is worth checking what a dataset has been through before processing it again.
Speckle is the other quirk. This grainy salt-and-pepper texture is not a sensor fault. It appears because the many small scatterers inside one resolution cell, such as individual blades of grass, add up differently from cell to cell. Analysts reduce it by averaging several looks or by filtering across neighboring pixels or across a time series, and every method trades something for the smoothness, either spatial detail or sensitivity to change. As a result, the pixel size printed on a data sheet, such as the 10 meters of common Sentinel-1 products, overstates the detail that remains usable after filtering.
Why the Aperture Must Be Synthetic
Radar waves are long, and the resolution of a radar image along the flight direction depends on the aperture of the radar beam. A longer antenna produces a narrower beam and finer detail. Antennas on aircraft are usually limited to 1 to 2 meters, and on satellites to roughly 10 to 15 meters. Finer resolutions would require a physical antenna that is hundreds of times longer and therefore not feasible.
SAR solves this with motion. A point on the ground stays inside the radar beam for many consecutive pulses while the satellite moves past. A processor combines all of those echoes, using the small frequency shifts caused by the motion (the Doppler effect), and calculates mathematically how the signal would look if it had come from one very long antenna. The distance the satellite travels while collecting those echoes is the synthetic aperture.
Resolution across the track works differently. It is set by the length of the transmitted pulse, and a shorter pulse separates objects better but carries less energy, which lowers the signal quality. Modern systems therefore send long pulses whose frequency sweeps up or down (a chirp) and compress them during processing, which gives the effect of a short pulse. Because the two directions depend on different parameters, the resolution along and across the track can differ.
This has a practical consequence. No image exists until the raw echoes have been processed, and that processing is demanding. In return, fine resolution comes from computation instead of from a large physical instrument, which is one reason small satellites can now carry SAR sensors.
Why Radar Works Through Clouds and Darkness
A SAR satellite is an active sensor, which means it supplies its own illumination instead of relying on sunlight. That is why it can collect data at night, which matters in polar regions where darkness lasts for months. Microwave wavelengths range from a few millimeters to a meter, far longer than visible light and also longer than the droplets in clouds, so the signal passes through them with little interaction. Smoke does not stop it either.
The difference is large in the tropics. In a NASA training on SAR, a comparison over Panama showed that an optical composite built from a full month of Sentinel-2 imagery still contained gaps from cloud, while a radar composite of the same month did not. For a project area under cloud almost every day, such as the one in my Indonesia project, that changes the schedule risk substantially, because the satellite collects data on its regular orbit pass whatever the weather is doing.
There are important limits. The common description is all-weather imaging, but the more accurate one is almost all-weather. Heavy rain cells, typical of tropical storms, can weaken the signal strongly, and wet vegetation and soil then appear unusually bright. The same training shows a Sentinel-1 scene over Ecuador where one year looks clearly different for this reason, and such an image cannot be corrected. Analysts discard it and use another date. Radar also does not penetrate water at the ground surface, and what it records is the surface response to microwaves, not a picture of what a person would see. A dark patch may be water, but it may also be a smooth road or a radar shadow behind a hill, so analysts resolve this with context, repeat observations, or other data sources.
The deliverable is also different. A SAR scene is not a LiDAR point cloud, so a project that truly needs a detailed ground model beneath dense forest cannot simply swap one sensor for the other. What changes is the freedom from weather when the question can be answered with radar products.
More Parameters Shape What the Sensor Measures
Cloud penetration is only one of several settings that decide what a SAR sensor measures. SAR systems are grouped into frequency bands, such as X, C, S, L, and P, with wavelengths from about 3 to 70 centimeters, and longer wavelengths penetrate deeper into vegetation, snow, and dry soil. Polarization, the angle at which the signal meets the ground, and the moisture of the surface change the returning signal further. The phase of the signal opens up an entirely different measurement, the detection of ground motion. In a densely forested region like the one in my Indonesia proposal, these settings decide whether the sensor responds to the canopy or to the ground below. Each of these topics could fill an article of its own, so the readings below are the best place to go deeper.
Further reading
- An Introduction to Synthetic Aperture Radar (SAR) and Its Applications | NASA Applied Remote Sensing Training Program
Explains how wavelength, polarization, incidence angle, and moisture shape the signal, and introduces interferometry, in a free three-part series. - Synthetic Aperture Radar (SAR) Basics | Google Earth Engine Community Tutorials
Defines SAR terminology and explains how backscatter, speckle, and terrain effects shape Sentinel-1 data. - Forest Stem Volume Estimation Using High-Resolution Lidar and SAR Data | Chalmers University of Technology
Compares small-footprint LiDAR with long-wavelength SAR for estimating tree volume in forests.
Where SAR Satellites Are Used Today
Ground motion monitoring is the most mature application. It relies on the phase of the returning signal. When a satellite images the same area twice from nearly the same position, the phase difference between the two images reveals how far the ground has moved along the line of sight, down to millimeters. This technique is called interferometric SAR, or InSAR, and it works best on stable surfaces such as buildings, roads, and bare rock. The European Ground Motion Service, part of the Copernicus Land Monitoring Service, applies it to the Sentinel-1 archive over most of Europe and provides measurements used to map landslides, subsidence, and the stability of infrastructure.
Flood mapping is the second major use, and it depends on revisit frequency. Several commercial operators, including ICEYE, Capella Space, and Umbra, fly constellations of small SAR satellites that can revisit a location daily or even more often. A NASA-funded project called HiFLOWS is using these constellations to capture Arctic and sub-Arctic floods near their peak, something older satellite systems often miss. Disaster response and insurance are among the main users of this kind of data.
The scattering physics described above supports many other uses. Oil smooths the sea surface, so a spill appears as a dark area against rougher open water. Double bounce makes flooded vegetation stand out, which allows researchers to track wetland flooding over time. Differences in structure and moisture separate forest from cleared land, support crop mapping, and distinguish smooth open water from sea ice. Some targets remain difficult. Mangroves, for example, change their appearance with the tide, and their aerial roots interfere with the signal in ways that differ from other forests.
Government science missions are expanding in parallel. The NASA and ISRO mission NISAR launched on July 30, 2025, and began science operations in January 2026. It is the first mission designed to provide systematic, global observations in two frequencies at once, L-band and S-band. According to the NASA training, the plan was to collect L-band globally and S-band only over selected areas, such as India and calibration sites, and to release all data openly. As a calibration and validation phase was planned to run until mid-2026, it is worth checking the current data availability before building a project around it.
How SAR Compares with LiDAR
If you work with LiDAR, much of SAR will feel familiar. Both are active sensors, both measure range from the travel time of a pulse, and both can operate at night. The two diverge on what they record. LiDAR typically uses near-infrared light, while radar uses microwaves with wavelengths roughly 100,000 times longer. A LiDAR pulse is a narrow ray, scanned across or along the flight path, that returns discrete points, each with an x, y, and z position. A SAR system must look sideways, as described above, and builds a two-dimensional image in which elevation is not measured directly.
These differences make the two sensors complementary more than competing. LiDAR gives a detailed three-dimensional model of terrain or vegetation structure at a known moment. SAR gives frequent, weather-independent observations over wide areas, plus change measurements at a precision a repeat LiDAR survey rarely reaches. In forests, for example, LiDAR can measure tree height and crown size while long-wavelength radar responds to the trunks. A LiDAR baseline combined with a SAR time series is a natural pairing.
What to Weigh Before Using SAR Data
Five questions help scope a project. How often does the answer need to be refreshed, since revisit times differ widely between systems? Which band and polarization respond to the surface of interest? Does the application need a detailed image, a measure of change, or both? Does the team have the processing capacity and radar expertise to interpret the result, or will it rely on a ready-made product such as the European Ground Motion Service? And which data are openly available? Sentinel-1 data can be downloaded from the Copernicus data hub, and the Alaska Satellite Facility and Google Earth Engine offer further archives, including some L-band data from Japanese satellites. Registration is required, but access is free.
Two habits prevent common mistakes in time series work. In hilly terrain, stay with either ascending or descending passes, because the viewing geometry differs between them and the same slope looks different. And compare images with the same polarization, wavelength, and angle, so that a change in the picture reflects a change on the ground.
As constellations grow and public archives accumulate, radar time series are becoming a routine input to analysis rather than a special request. The interesting shift is not only in what SAR can see, but in how often a map can be refreshed once repeat observation becomes cheap, and in how much weather risk disappears from the project plan when the sensor does not care about the sky.
Further reading
- What Is Synthetic Aperture Radar? | Sandia National Laboratories
Gives an intuitive explanation of the synthetic aperture and Doppler processing. - European Ground Motion Service | Copernicus Land Monitoring Service
Provides the Sentinel-1 ground motion data discussed above for viewing and download.