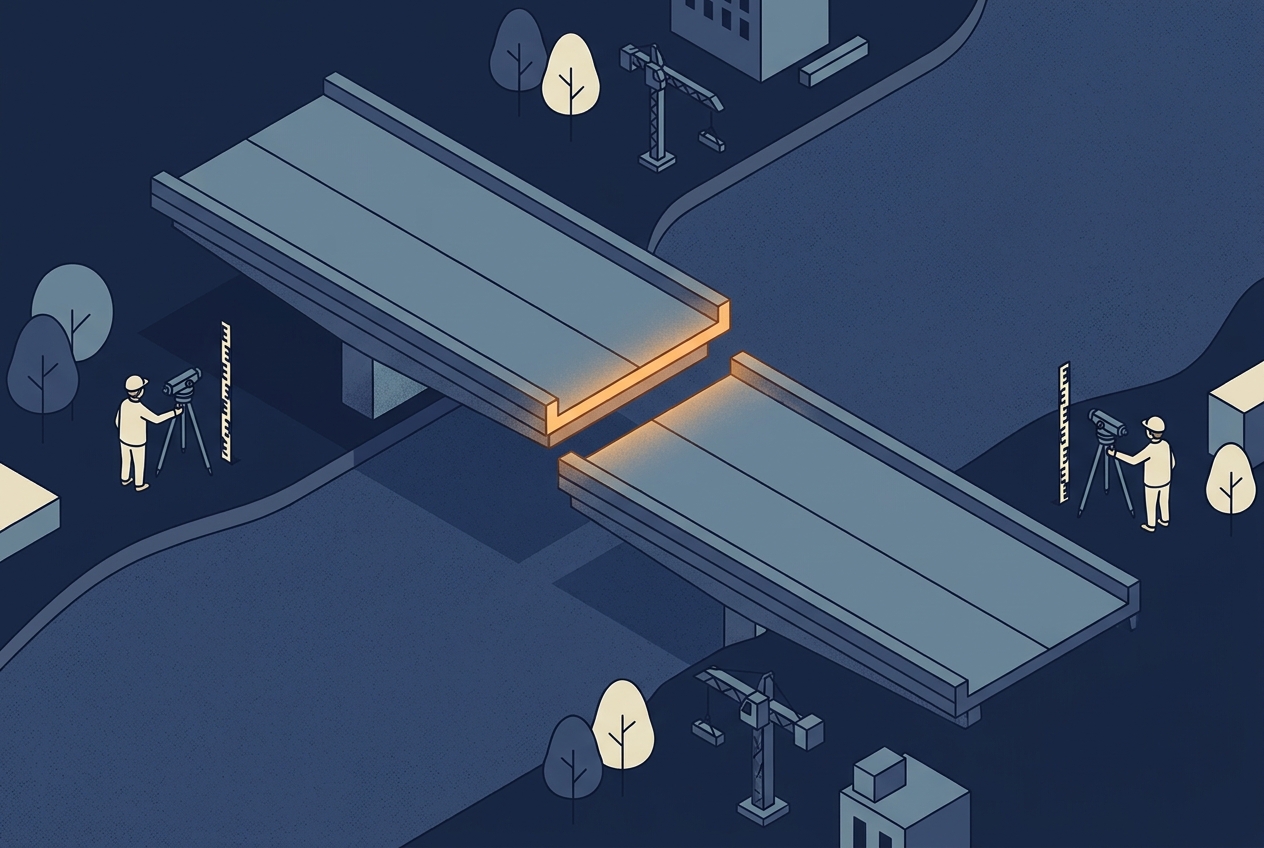
In 2003, construction crews building the new Rhine bridge between Laufenburg in Germany and Laufenburg in Switzerland noticed that the two halves of the bridge would not meet. They were set to miss each other by 54 centimeters in height. Nobody had measured anything wrong. Germany referred its heights to the North Sea, through the Amsterdam tide gauge, and Switzerland referred its heights to a benchmark tied to the Mediterranean. The engineers knew that the two systems differ by 27 centimeters and had planned for it. During the work, the correction was applied with the wrong sign, and 27 centimeters became 54.
The bridge was fixed before it opened, but the story is a good reminder of something that is easy to forget when working with elevation data: a height is always a height above something. LiDAR point clouds are no exception. Every point carries a Z value, and that value only means something if you know which surface it was measured from. In LiDAR data the possible offsets are much larger than 27 centimeters, and some of the most damaging ones are small enough to go unnoticed. This article explains the surfaces behind a height, how a LiDAR point gets its elevation, the typical ways height errors show up in a delivery, and what to check before you trust the numbers.
Three Surfaces Behind Every Height
The first surface is the ellipsoid. It is a smooth mathematical shape, slightly flattened at the poles, that approximates the size and shape of the Earth. GNSS positioning works on this surface. A height measured from it is called an ellipsoidal height (usually written as h), and it is what a GNSS receiver produces before any correction is applied.
The second surface is the geoid. It is the surface of equal gravity potential that best matches mean sea level, extended under the continents. Water flows downhill relative to the geoid, not relative to the ellipsoid, which is why the heights we use for drainage, flood modeling, and construction are referred to it. A height above the geoid is called an orthometric height (H). Because the mass inside the Earth is not evenly distributed, the geoid is bumpy. Globally it lies between about 106 meters below the ellipsoid (south of India) and 85 meters above it (around Iceland). The separation between the two surfaces at a given location is the geoid height (N), and the three values are linked by a simple relation: h = H + N.
The third surface is the terrain itself, which is what LiDAR actually measures. The other two only define where zero is.
In practice, the clean textbook picture has a complication. The national heights printed on maps and used by engineers are usually not pure geoid heights. They are defined by a national leveling network and a starting point at a tide gauge, which is exactly why Germany and Switzerland ended up 27 centimeters apart. Finland’s N2000 system, for example, is a Finnish realization of the European height system and derives its zero from the Amsterdam tide gauge. Switzerland still uses two height systems side by side: the official LN02, which comes from leveling without gravity corrections, and LHN95, which is a modern orthometric system. The two differ enough that swisstopo publishes a separate transformation between them.
This is why the “geoid model” delivered by a national mapping agency is best understood as a transformation surface. It converts ellipsoidal heights from GNSS into the heights of that country’s system, and it is fitted to that system’s leveling network. Finland’s current model, FIN2023N2000, was released by the National Land Survey of Finland in January 2024 with an accuracy of about 1.4 centimeters. Switzerland’s model, CHGeo2004, reaches an accuracy of 1 to 3 centimeters. Both are tied to their own national height system and are not interchangeable with a global model or with each other.
Further reading
- Geoid | National Land Survey of Finland
A short explanation of the geoid and of how GNSS heights are converted to N2000 heights in Finland. - The Swiss Geoid Model CHGeo2004 | swisstopo
How the Swiss geoid was determined and how it connects GNSS heights with the Swiss height systems.
With the surfaces defined, the next question is which of them a LiDAR point is actually measured from when it leaves the aircraft.
Where a LiDAR Point Gets Its Height
Every LiDAR point is computed from three things: the measured range, the direction of the laser beam, and the position and orientation of the sensor at the moment the pulse left. The sensor position comes from GNSS, so the trajectory is calculated in ellipsoidal heights, and every point initially inherits them. At this stage, the point cloud describes the terrain as heights above the ellipsoid in the reference frame of the GNSS solution.
Converting those heights into a national height system is a separate processing step. The software looks up the geoid height N at each point’s location in a geoid model and subtracts it. The step is simple, but it is also easy to skip, repeat, or run with the wrong model, and nothing in the point cloud itself tells you which of these happened.
The horizontal side of the coordinate system has a similar trap, with time added. GNSS positions are natively computed in a global frame that moves with the average of all tectonic plates, while the European system ETRS89 is fixed to the Eurasian plate. Because Europe drifts at about 2.5 centimeters per year, coordinates in the two frames have moved apart by roughly 90 centimeters since 1989. A processing chain that treats them as the same frame will shift the whole dataset, and the error grows every year.
All of these conversions happen before anyone looks at the data, which is why the errors they produce tend to have a recognizable signature once they do.
How Height Errors Show Up in a Delivery
The most common error is a missing conversion: the data is delivered in ellipsoidal heights, but the user assumes they are heights above sea level. The whole dataset is then offset by the geoid height, which in most of Europe is tens of meters. A lake appears to lie far above or below its known water level, and a comparison with any existing terrain model shows a large, nearly constant difference. The opposite error, applying the geoid correction twice, produces an offset of the same size in the other direction.
These large errors are annoying, but they are rarely dangerous, because they are too big to miss. The harmful errors are smaller. If a global geoid model is used instead of the national one, or an older national model instead of the current one, the result is an offset of a few centimeters to more than a meter that varies slowly across the project. It can look like a gentle tilt, or like a small systematic difference to a neighboring dataset. In a flood model or a volume calculation, a decimeter of systematic error is enough to change the answer, and it is small enough to be blamed on the sensor, the strip adjustment, or the ground control instead.
A third error lives in the metadata rather than in the numbers. A point cloud can be converted correctly but labeled incorrectly. A LAS file stores its coordinate system in a header record, and in LAS 1.4 that record is written as a text description (WKT). Many files describe only the horizontal system and say nothing about heights. A complete description is a compound coordinate system, which combines a horizontal system with a vertical one. Finland’s national laser scanning data, for example, is delivered in ETRS89 / TM35FIN coordinates with N2000 heights, and both parts are named. When the vertical part is missing, the next person to use the data has to guess.
Even a complete description can cause trouble if software reads it differently. In one case discussed in the LAStools user group, LAS 1.4 files would not open in ArcGIS at all. The cause was a single missing comma in the compound coordinate system text written by a conversion tool. Martin Isenburg of rapidlasso fixed the bug and argued that readers should warn about damaged coordinate system records instead of refusing the file, which is a reasonable wish. It also shows how fragile the link between the numbers and their meaning can be.
Further reading
The LAStools user group discussion of the ArcGIS loading problem is a short, practical example of how a coordinate system record in a LAS 1.4 file can fail, and of the debate about how strict software should be when reading one.
All of these errors assume that the reference surfaces themselves stay still. In some parts of Europe, they do not.
Heights That Change Over Time
Finland is still rising after the last ice age. The land uplift is strongest around the Gulf of Bothnia, and it slowly changes both the ground and the relationship between the ground and the sea. This is why Finnish heights come with a reference year. The current system, N2000, is fixed to the year 2000, while the previous system, N60, was fixed to 1960. Heights in the two systems differ by 13 to 43 centimeters, and according to the Finnish Meteorological Institute most of that difference is land uplift over 40 years. The National Land Survey of Finland has also noted that uplift distorts elevations, coordinates, and gravity values over time, which is one reason the geoid model had to be renewed.
For a single survey, this rarely matters. It matters a great deal when surveys are compared. National LiDAR programs are increasingly used to measure change between flights that are years apart, whether the change is forest growth, erosion, or a slope that has started to move. If the first survey was delivered in one height system or with one geoid model, and the second in another, part of the measured change is simply the difference between the reference surfaces. In hazard mapping or coastal work, where a few centimeters decide the result, the version of the height system matters as much as the sensor that collected the data.
What to Check Before You Trust the Elevations
When you receive LiDAR data, or commission it, the most useful question is not “which coordinate system?” but “which height system, and which geoid model in which version?” The answer should appear in the delivery report and in the file itself as a compound coordinate system. If only the horizontal system is named, ask before you use the heights.
A quick independent check is worth more than any metadata. Compare the ground points in a flat, open area with a known benchmark, a national terrain model, or a lake with a published water level. The size and pattern of the difference usually tell you what went wrong. A constant offset of tens of meters points to a missing or doubled geoid correction. A difference of a few decimeters that changes slowly across the project points to the wrong geoid model. A difference that matches the edges of flight lines is not a datum problem at all, and belongs to calibration and strip adjustment.
Height systems are also changing. Several countries are moving toward heights that are defined directly by a geoid model and GNSS instead of by a leveling network, and the United States is replacing its national height datum with one of this kind as part of the modernization of its National Spatial Reference System. Once that happens, the geoid model is no longer a helper that converts between two systems. It becomes the height system itself. The question behind the Laufenburg bridge, “above what, exactly?”, will not go away. It will simply move from the tide gauge into a file that every LiDAR workflow depends on.
Further reading
- An Embarrassing Discovery During the Construction of a Bridge | Normaal Amsterdams Peil
A short account of the Laufenburg bridge error and the two height systems behind it. - Sea Level Height Systems in Finland | Finnish Meteorological Institute
How N60 and N2000 differ, and how land uplift shapes Finnish heights over time.